| Share/Comment | |||
 |
Tweet |  |
|
 |
Feedback |  |
|
Let us revisit the frequency distribution table for pizza delivery time that we created in section on Statistics Simplified.
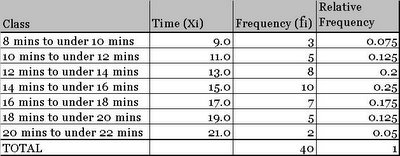
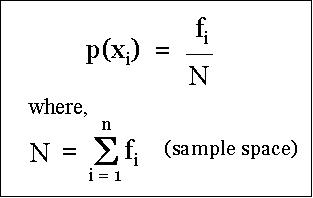
If the above data is our "sample space" then what is the probability of delivering pizza between 14 and 16 minutes? Clearly it is 10 divided by 40 equal to 0.25. Let us re-write the formal equation for computing the probability.
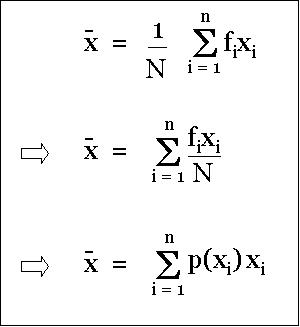
Now, recall the formula of computing the mean from a frequency table. And watch, how probability fits in to the formula.
comments powered by Disqus
Commenting Guidelines
We hope the conversations that take place on “discover6sigma.org” will be constructive in context of the topic. To ensure the quality of the discussion stays in check, our moderators will review all the comments and may edit them for clarity and relevance.
The comments that are posted using fowl language, promotional phrases and are not relevant in the said context, may be deleted as per moderators discretion.
By posting a comment here, you agree to give “discover6sigma.org” the rights to use the contents of your comments anywhere.