| Share/Comment | |||
 |
Tweet |  |
|
 |
Feedback |  |
|
A Pareto Chart depicts the frequency with which certain events occur. It is a bar graph where each frequency (or frequency range) is shown in a descending order of importance of data, from left to right.
This is based on the Pareto Principle, also called 80-20 rule or rule of vital few. Formulated by the father of quality - Dr. Juran and named after the famous Italian economist Vilfredo Pareto, this principle helps separate the "vital few" from the "useful many" in any business scenario. It helps us identify and focus on "vital few" to maximize our returns on investments on resources.
To develop an exact understanding of the concept, let us go back to our famous pizza shop example. Here is some old customer complaint data before they mastered the thirty minutes pizza delivery.
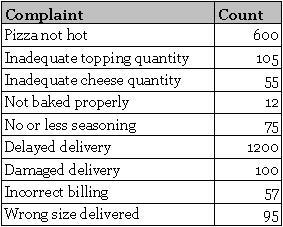
The pizza shop wanted to develop a strategy to reduce the customer complaint dramatically. This is where Pareto Chart comes in to action. Let us see how.
To create a Pareto Chart, this data is sorted and cumulative count & percentages are computed as illustrated in the following table.
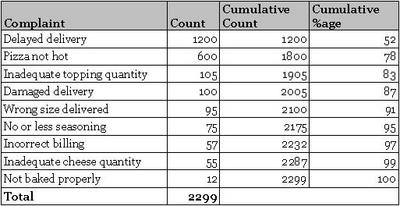
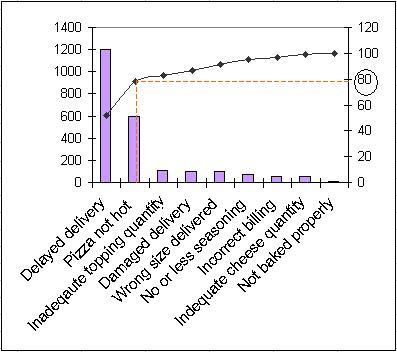
Using this data. a bar-cum-line graph is drawn using a standard spreadsheet like MS Excel. The bar represents the count of each complaint and the line illustrates the cumulative complaint count percentages.
| Share/Comment | |||
|
Tweet | |
|
|
Feedback | |
|
With this graph, finding the vital few is simple. Locate the 80% point on the right y-axis and find the corresponding point on the x-axis. It clearly highlights that we need to address "delayed delivery" and "pizza not hot" complaint categories to take care of 80% of the customer complaints. In fact, the "pizza not hot" complaint was partially the result of "delayed delivery" problem. These two complaint categories only constitute 22% of all the complaint categories. Can we see the 80-20 rule? It is evident that by fixing only 20% (22% to be precise) of the complaint categories solve 80% (78% to be precise) of the customer complaints. This helped our pizza shop to focus on solving the right set of the problems
comments powered by Disqus
Commenting Guidelines
We hope the conversations that take place on “discover6sigma.org” will be constructive in context of the topic. To ensure the quality of the discussion stays in check, our moderators will review all the comments and may edit them for clarity and relevance.
The comments that are posted using fowl language, promotional phrases and are not relevant in the said context, may be deleted as per moderators discretion.
By posting a comment here, you agree to give “discover6sigma.org” the rights to use the contents of your comments anywhere.